
Having a tool that provides you the power to put a system under load is something that attracts everyone. Jmeter is such an open source tool to work on. It is very powerful tool when it comes to performance & API testing. I am starting this series of articles to share my knowledge of the tool in various aspects.
For today, we will understand the basic terminology used in Jmeter and a simple test run for “How to create a load test?”.
For those who have never heard about Jmeter, it’s an open source tool provided by Apache Jakarta Project. There is ample documentation, forums and help available online for the tool.
Following are the terms you need to know as they would be encountered very frequently.
- Test Plan
Test Plan is the container for all the configurations and settings applied for the specified tests - Thread Group
Thread Group is used to execute the particular test case against your server, here you can decide the number of users and ramp up period - Thread
Thread is referred as the virtual user in Jmeter, if you keep the Thread count as 100 that means 100 virtual user will be introduced into the AUT - Listeners
Listeners are the features that will store the result of the tests run by you, there are number of listeners available in the Jmeter that you can use for various analysis purpose
Now, let’s quickly move to see how to load test an application with Jmeter.
Prerequisites :
- Java – 1.6 or above
- Apache Jmeter – 2.9 or above
Click here to download apache Jmeter
Step 1 – Launch the Jmeter by clicking Jmeter windows batch file under bin folder
Step 2 – Right click on the TEST PLAN, ADD & Thread Group to add a thread group

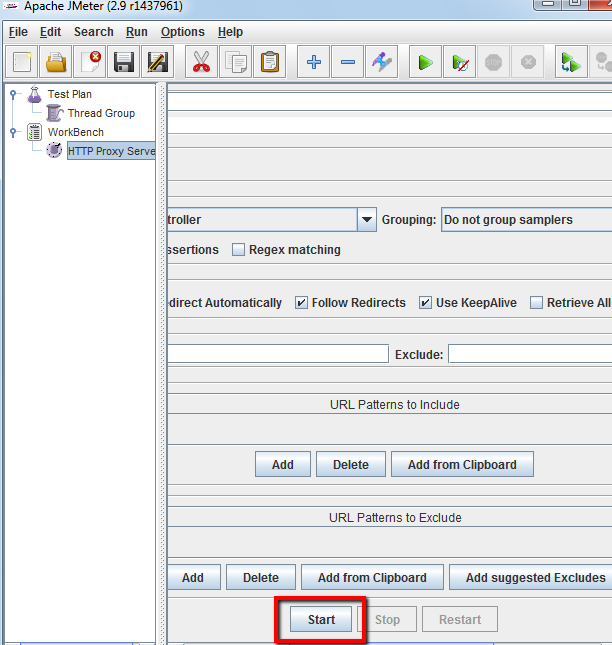
Step 3 – Right click on Workbench, ADD & add HTTP Proxy Server

Step 4 – Set the proxy into your browser, I used Firefox browser

Step 5 – Click on Start button in the Proxy Server and record the scenario for the application you want to load test in the browser. Once your scenario is complete click the Stop button beside the Start in the proxy server.
Step 6 – You should see the recorded HTTP requests under Thread Group , it’s time now to set the number of threads and add listeners
Step 7 – Assign the number of threads, ramp up and iterations
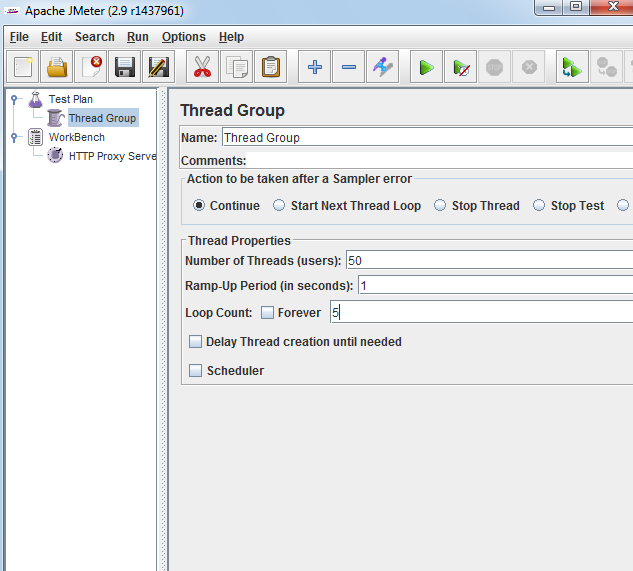
This is a very important step, here you have to be careful while assigning the number of threads, you shall use your own application for the practice. It is not recommended to put load on others’ applications.
Ramp up period is the time duration which assures the rate of users entering the application per second. For example if you provide ramp up period as 20 seconds for 50 users then Jmeter makes sure that all 50 users enter the application in 20 seconds.
Number of iterations define the number of times the assigned number of threads will execute the test.
Step 8 – Add Listeners

For start you shall add Summary Report and View Results In Tree listeners
Step 9 – Save the test plan by clicking the historical floppy disc icon and hit run. Switch over to the summary report and view results in tree listener to analyse the results.
This is just a start to get familiar with the feel of Jmeter, there is a lot more in Jmeter to explore. Watch out for my next article to dig deep into the Jmeter world.

Good to see you back blogging after a long time. Keep doing this often and motivate me to do so 😉 😛
BTW thanks for a kick start post bro 🙂
Thanks Dheeraj, and sure I will keep writing as I have started this series of Jmeter articles.
good work bro…keep it up